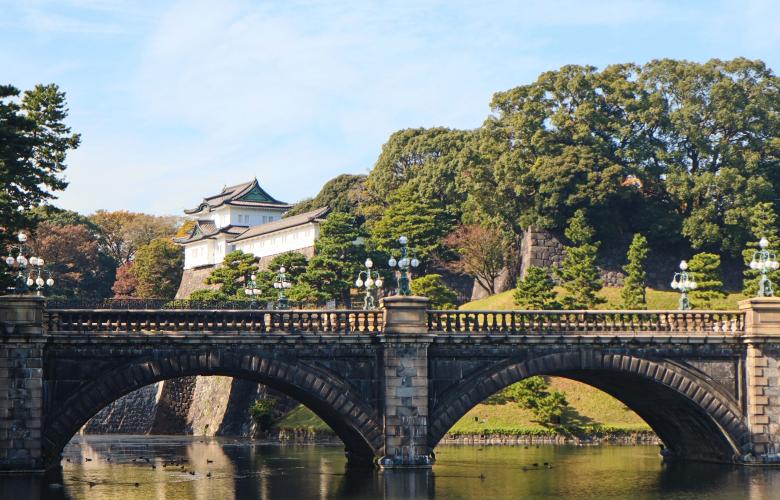
Chiyoda ward is the geographic centre of Tokyo. There isn't a lot of residential inventory in the ward and the property that is available is some of the most sought after in Japan.
If you look at the ward in satellite view in Google Maps, it becomes clear why; despite being in the centre of Tokyo, there isn't a lot of tradeable real estate at all.
Most of the land is taken up by the Imperial Palace and the parks and grounds surrounding it near Kudanshita station, the National Diet and related government buildings near Kasumigaseki station, mixed use commercial buildings surrounding Tokyo station and retail shops around Akihabara station.
In historical times, one's proximity to the Emperor was a status symbol; the closer you lived, the more important you were.
Near Hanzomon station, the bancho series of addresses within the ward are numbered for this reason. One-bancho (in Japanese Ichibancho) literally translated means "number 1 town". This address is directly west of the Imperial Palace grounds.
The bancho series continues via adjacent lands in sequential series until six-bancho (Rokubacnho).
It is within these addresses where the highest concentration of residential inventory is.
How to Use the Chart
The chart loads with all areas showing. To limit the view, click or press on the Enter series to show field and scroll the drop down menu that reveals for the station you are looking for.
To delete a station, click or press the x next to the station name.
Please note that if you are using ad blockers then it may interfere with the display of the data. If so then copy the URL into another browser that doesn't use ad blockers.
Source: tochidai.info (Japanese)
Notes on the Data:
Tochidai.info visualises the Rosenka value, or street value, of the land using the same pinpoint addresses the tax department uses to calulate the land portion of annual property taxes.
Tochidai.info organizes the data by addresses with geo codes nearby popular stations, which is how the above information has been aggregated.
This data is not to be taken as actual market value as often in the metropolis areas areas of Japan, a property can often sell for higher than what the tax department assesses the property value at.
The data represented in the above chart is only to illustrate pricing trends over a series of time. The data in no way guarantees accurate market pricing for the reasons outlined above as other factors contribute to the pricing of real estate such as type and age of structure, specific building only incidents or accidents, whether a property is self-managed or professionally managed etc.
For further, more specific information, contact one of the agent contributers here on REthink Tokyo.
Make sure to inquire with an agent working in your area of interest.
Further Reading
Minato Ward Popular Station Land Pricing Trends (REthink Tokyo; September 2021)
Shibuya Ward Popular Station Land Price Trends (REthink Tokyo; September 2021)
Chuo Ward Popular Station Land Pricing Trends (REthink Tokyo; October 2021)


